Metrics in Data Science
Metrics in Data Science
Evaluation metrics for classification
A classification model is evaluated on the test data. The common metrics used to evaluate the model are listed as
- Accuracy,
- Confusion matrix,
- Precision and Recall,
- Sensitivity and Specificity,
- F1Score and weighted F1,
- ROC curve and AUC ROC.
Accuracy is the ratio of correctly classified examples to the total number of examples in the test set. Defining true examples (TE) and false examples (FE) the number of correctly and incorrectly classified examples in the test set, accuracy can be given as
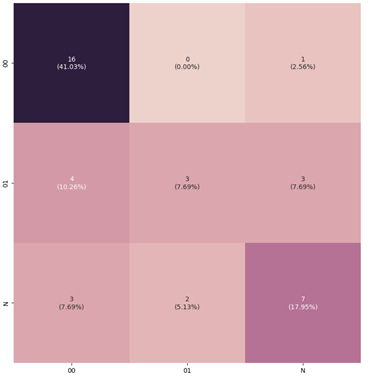
The confusion matrix is a metric to visualize the classification performance. The rows of the matrix represent the true classes and the columns shows the predicted classes or vice versa. Both versions are used and can be found in the literature. Here we use the first version. The element (i,j) of the matrix shows the number of test examples belonging to class and classified as class . Thus besides showing the number of correctly classified examples for each class, the confusion matrix gives an idea of typical missclassifications the model makes. An example confusion matrix can be seen in Figure 16.
The metrics precision and recall, sensitivity and specificity as well as F1Score and weighted F1 were originally introduced for binary classification models, but their usage can be extended to multiclass case. Therefore they will be defined and explained first for binary classification model.
In terms of binary classification with positive and negative classes, the outcome of the classification task can fall in one of four cases: correctly/incorrectly classified examples belonging to positive/negative class. The prediction is true positive (TP) when a positive example is correctly classified, like e.g. presence of a disease. A false negative (FN) prediction occurs when a positive example is classified by the model as would belong to negative class. Similarly a true negative (TN) prediction occurs when a negative example is correctly classified. Finally the prediction is false positive (FP) when a negative example is classified as would belong to positive class. These cases are summarized in Table 8.
| predicted true | positive | negative |
|---|---|---|
| positive | true positive (TP) | false positive (FP) |
| negative | false negative (FN) | true negative (TN) |
For the case of binary classification the definition of Accuracy can be given alternatively as
The terms TP, FN, TN and FP are also used to denote the number of corresponding cases, e.g. TP also denotes the number of true positives.
Precision is the ratio of the correctly classified positive examples to the total number of examples classified as positive:
In contrast to that Recall is the ratio of the correctly classified positive examples to the total number of positive examples:
The measures sensitivity and specificity are also commonly used, especially in the healthcare.
Sensitivity is the True Positive Rate (TPR), i.e. the proportion of captured trues and hence it equals to recall.
Specificity is the proportion of the captured negatives, i.e. True Negative Rate (TNR).
The F1Score is a harmonic mean of precision and recall and therefore it is a number between and .
| Metric | When to use ? |
|---|---|
| Accuracy | In case of classification problem |
| with balanced classes. | |
| Precision | When it is important to be sure about the |
| positive prediction to avoid any negative | |
| consequences, like e.g in case of decrease | |
| of credit limit to avoid customer dissatisfaction. | |
| Recall | When it is important to capture positive even |
| with low probability, like e.g. to predict | |
| whether a person has illness or not. | |
| Sensitivity | If the question of interest is TPR, |
| i.e. the proportion of the captured positives. | |
| Specificity | If the question of interest is TNR, |
| i.e. the proportion of the captured negatives. | |
| F1Score | When both Precision and Recall are important. |
| weighted F1 metric | When importance of Precision and Recall |
| against each other can be characterized | |
| by weights explicitly . | |
| ROC curve | It is used for determining probability threshold |
| for deciding the output class of the task, | |
| see Figure x. | |
| AUC ROC | It is used to determine how well the positive class |
| is separated from the negative class. |
The weighted F1 metric is a refined version of F1Score, in which Precision and Recall can have different weights.
where Recall has weight and is the weight of Precision.
In a multi-class setting the metrics precision and recall, sensitivity and specificity as well as F1Score and weighted F1 metric are calculated first for each class individually and then averaged. This way they quantify the overall classification performance.
The metrics ROC curve and AUC ROC are defined for binary classification task. The Receiver Operating Characteristic (ROC) curve is the True Positive Rate (=Sensitivity) as a function of the False Positive Rate (= ). The Area Under Curve ROC is called AUC ROC. It indicates how well the positive class is separated from the negative class.
The usage of the different metrics are summarized in the Table 9.

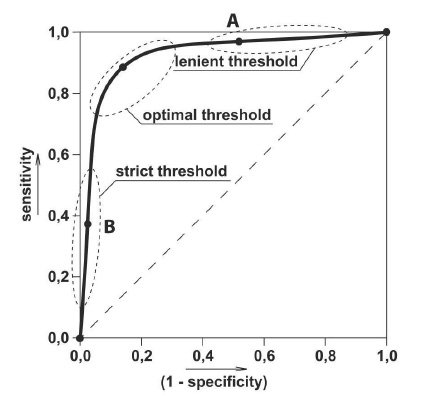
Depending on the use case strict, optimal or lenient (= moderate or high) probability threshold can be selected on the ROC curve. This is illustrated in Figure 17.
Evaluation metrics for regression
The common metrics used for evaluating regression models are are listed here.
- Mean Squared Error (MSE),
- Root Mean Squared Error (RMSE)
- Mean Absolute Error (MAE),
- Mean Absolute Percentage Error (MAPE),
- Coefficient of Determination (COD), R-squared (),
- modified R-squared,
The Mean Squared Error (MSE) is one of the basic statistic used to evaluate the quality of a regression model. It is the average of the squares of the difference between the real and predicted values, in other words:
A similar measure is the Root Mean Squared Error (RMSE), which is the square root of MSE and thus it is biven as
The Mean Absolute Error (MAE) is the average absolute difference between the real and predicted values.
The mean absolute percentage error (MAPE) quantifies the average of the ratio of the average absolute difference between the real and predicted values to the real value as a percentage. Hence the formula of MAPE can be given as
The metric Coefficient of Determination (COD) is also referred as R-squared and it is denoted by or and pronounced as "R-squared". The coefficient of determination determines the predictable proportion of the variation in the dependent variable, . Let denote the mean of the output values, in other words
The coefficient of determination is defined in terms of residual sum of squares, and total sum of squares (related to the variance of ),
as
The metric modified (or adjusted) R-squared is introduced to compensate that increases when the dimension becomes higher. Denoting the dimension of by , the modified R-squared, is defined as
Evaluation metricS for KG
Quality of KG
The two most important quality measures of a KG are
- completeness and
- accuracy.
The completeness refers to evaluate the amount of existing triplets in the KG, while accuracy targets to measure the amounts of correct and incorrect triplets in the KG. After KG completion the resulted extraction graph is considered to be not yet a ready KG. Therefore quality measurement of KG is relevant only after KG refinement.
Evaluation metric for KG refinement
Usually completeness is measured in recall, precision and F-measure.
The accuracy of the KG, i.e. the amounts of correct and incorrect triplets is evaluated in terms of accuracy and alternatively, or in addition by means of AUC (i.e. the area under the ROC curve).
The accuracy of the KG, can be also based on the correctness of the individual triplets , which can be assigned by human e.g. based on random sampling. Then is given by
In case of human judging, the usual evaluation metric is accuracy or precision together with the total number of judged triplets and errors found.
Evaluation metric for link prediction with KG embeddings
The used evaluation metric for link prediction with KG embeddings depends on the subtask of link prediction, see in Table 10.
| Subtask | Evaluation metrics |
|---|---|
| Entity prediction | rank based measures |
| Entity type prediction | Macro- and Micro- |
| Triple classification | accuracy |
The rank based evaluation metrics for entity prediction include
- Mean Reciprocal Rank (MRR) and
- Hits@K.
Mean reciprocal rank is the average of the reciprocal ranks of the correct entities:
Hits@k is the proportion of the correct entities in the best k predictions:
Hits@k.
Larger the Hits@k better the entity prediction and hence also the used KG embedding model.


